The command line
dirigent is installed as dirigent, with dg as the short alias. It is two things at
once: the operator's remote for a running instance, and the process entry point a container
runs. Nouns are subcommand groups matching the API resources; the only top-level verbs are
the ones you reach for constantly.
Almost every command is one or more API calls, so what the CLI does here the UI and a script
can do too. The exceptions are the process-side ones -- dg db, dg system health,
dg connection ensure, dg admin user create, dg prune, dg secret-key, dg init and
dg run --local -- which read the configured database or the local filesystem and present no
token, because they are what runs where no server is answering yet.
--json is a global option and asks for records at a terminal, which is what a pipe gets
without asking. What it produces is the record protocol below rather than a dump of the
server's response, except where a command answers with a single document. Two commands answer
the same way whatever is asked of them, and they are named
further down.
Trying it without installing anything
Installing dg is the first step of getting started.
dg examples show --local reads the corpus installed beside dg, so the document comes from
the install and no checkout is needed; - on stdin and a URL are the other two ways to hand
dg run --local a document.
dg run --local applies and runs a document in a throwaway SQLite instance in a temporary
directory, and deletes it afterwards. No server, no Docker, no database. It is the same
apply, the same engine, and the same worker loop as a real instance, because a local run
that executed differently would prove nothing.
Talking to a server
dg dev                                  # a local instance: API, worker, one SQLite file
# its state is .dirigent/state, kept between starts; --wipe-state starts from nothing
# on an empty state its admin is dev / dirigent-dev, a fixture; the starting record carries
# the token, minted once, so copy it out of that line
export DG_URL=http://127.0.0.1:3333 DG_TOKEN=...

dg init my-pipelines && cd my-pipelines && uv sync
uv run dg examples list --starter       # the documents a project may copy
uv run dg pipeline new report-to-file   # one of them, into pipelines/
uv run dg apply --dry-run               # the whole-project plan
uv run dg apply
uv run dg run report-to-file --watch
Profiles
A profile names a server and how to obtain a token for it. Profiles are resolved from
.dirigent/profiles.yaml, found by walking up from the working directory, and then from
~/.config/dirigent/profiles.yaml -- so cd-ing into a pipeline repository points the CLI at
that repository's server without anyone remembering a flag.
# ~/.config/dirigent/profiles.yaml
default: local

profiles:
  local:
    url: http://127.0.0.1:3333
    token: dev-token                      # inline is fine for a local dev server

  staging:
    url: https://dirigent-staging.example.org
    token_env: DG_STAGING_TOKEN           # read from the environment

  prod:
    url: https://dirigent.example.org
    token_cmd: pass show dirigent/prod    # any command that prints the token
    api_prefix: /dirigent/v1              # only if that instance moved its API
api_prefix matches the instance's own setting of the same name, and defaults to /api/v1.
An instance that moves its API has to say so here too, or its own CLI cannot reach it.
Precedence is --url / --token flags, then DG_URL / DG_TOKEN, then the selected
profile. A .env at the root of the project, beside .dirigent/, stands in for any of these
variables the shell does not set, including the one a token_env names: that is where
dg init puts the token it mints, and where a DG_STAGING_TOKEN for the profile above can
live too. The shell's own value always wins over the file's. The same file is the settings
layer under the environment, which is how the DIRIGENT_SECRET_KEY beside that token reaches
every command run in the project directory.
A profile holds a URL and a token, and nothing else. It never holds a database URL, and one that names a database scheme is refused on sight: a CLI that could reach the database would bypass authentication, attribution, and validation entirely. There are three disjoint configuration planes and this is only the first of them:
| Plane | Holds | Lives |
|---|---|---|
| Profiles | A server URL, and how to get a token | Beside you, in a project or ~/.config |
| Server settings | DIRIGENT_DATABASE_URL, DIRIGENT_SECRET_KEY, the artifact root |
The environment, the project's .env, or dirigent.yaml, on the host running the server and the workers |
| Connections | Third-party credentials | Encrypted inside the server's database |
Seeing a pipeline's shape
A document holds the whole graph before anything runs, so nothing has to execute for its
shape to be read. dg pipeline show, dg validate, and dg apply --dry-run draw it as an
indented tree: roots at the left margin, each step under the last step it waits for, its
block beside it, and its trigger rule named when it is not the default all_success.
steps of parallel-sleep  each step under the last one it waits for
  slow  (time.sleep)
  medium  (time.sleep)
  quick  (time.sleep)
    report  (shell.run)  also after slow, medium
A step with several dependencies is drawn once, under the last of them, and names the others:
one step is one line, whatever its in-degree. --json is unaffected -- it returns the
document and the structured plan, not a drawing.
What the work will cost
The tree says what runs; dg validate --explain says what it will cost. Every pipeline
document that checks out gets a second record, validation.shape, with one row per step --
how wide it fans out, how many attempts it allows, how long it may spend in backoff, and the
waits it declares -- and the totals over them.
dg validate --explain examples/patterns/fan-out-item-wise.yaml
dg validate --explain --server pipelines/nightly.yaml   # a sensor takes the block's defaults too
what fan-out-item-wise will cost
┏━━━━━━━━━━━┳━━━━━━━━━━━━━━━┳━━━━━━━━━━━━━━┳━━━━━━━━━━┳━━━━━━━━━━━━┳━━━━━━━━━┳━━━━━━━━━━┳━━━━━━┓
┃ step      ┃ block         ┃ cardinality  ┃ attempts ┃ retry wait ┃ timeout ┃ deadline ┃ poll ┃
┡━━━━━━━━━━━╇━━━━━━━━━━━━━━━╇━━━━━━━━━━━━━━╇━━━━━━━━━━╇━━━━━━━━━━━━╇━━━━━━━━━╇━━━━━━━━━━╇━━━━━━┩
│ shape     │ transform.jq  │ 3  continue  │ 1        │ -          │ -       │ -        │ -    │
│ write_one │ storage.write │ adopts shape │ 1        │ -          │ -       │ -        │ -    │
│ manifest  │ transform.jq  │ 1            │ 1        │ -          │ -       │ -        │ -    │
└───────────┴───────────────┴──────────────┴──────────┴────────────┴─────────┴──────────┴──────┘

the whole document
steps           3
attempts        at most 7
deadline chain  -
A cardinality is a number wherever the document fixes one: a literal list, or a
${params.x} the document gives a default. adopts <step> is a step mapping over another
fan-out's grid, and it is as wide as that grid. unknown is a width only the run can fix --
a parameter with no default, a window's bounds -- and the attempts total then counts that
step once and reads at least rather than at most. attempts is every automatic try the
document allows, which is each step's max_attempts times the items it maps over; the
deadline chain is the longest run of deadlines through the graph, which is the wait the
document allows end to end.
Offline the document's own values are all there is. --server reads the catalog too, so a
sensor that declares neither poll nor deadline takes the block's own defaults and the row
marks what came from there. The warnings name what is unbounded rather than merely large: a
fan-out nothing here can size, a retry budget longer than the deadline each attempt waits
under, and a sensor no deadline bounds. Item says what a cardinality
means; dg runs profile is the same shape measured after the fact.
Examples, and starting from one
Every installed plugin ships documents, and an instance serves them: dg examples list is
that catalogue, the packs' shelves included. A document that opted in to being copied wears
the starter tag, and dg pipeline new copies it.
dg examples list                              # everything the instance ships
dg examples list --starter                    # only what may be copied
dg examples list --tag http --tag starter     # every tag named must be worn
dg examples list --shelf recipes --plugin examples
dg examples show http-post-report             # the document, verbatim
dg examples show http-post-report -f pipelines/mine.yaml   # written to a file; a redirect would keep a record
--local reads the corpus installed beside dg instead of the instance's, which is what a
machine with no server to address has.
dg pipeline new http-post-report              # writes pipelines/http-post-report.yaml
dg pipeline new http-post-report --code weekly-report --dir pipelines
The copy is the starter's text verbatim: the top-level code: is rewritten and the
starter tag dropped, so every teaching comment in it survives and no macro language is
involved. The connections and schemas the original carried, so that it ran alone under
dg run --local, are named under the copy's requires: instead, so the preflight tells you
what to create. Its knobs are its own params, and its preflight is its own requires,
which the command prints as the list to work through -- the dg connection create lines,
each with the kind the carried definition named, the schemas to apply, the packs a block
needs. A code that is not in the catalogue, or one that is an example and not a starter, is
refused and nothing is written; so is a file that is already there.
Projects
A project is a directory of documents: a working set, never a second source of truth. The server remains the only place a definition actually exists.
dg init hello                          # at a terminal: one form asks everything below
dg init hello --template local         # an instance on this machine, and the documents that address it
dg init hello --template compose       # the documents and a container stack to run them on
dg init hello --template documents     # the documents alone, against an instance elsewhere
dg init hello --template compose --service s3 --service docker --pack dirigent-dhis2 --workflow
dg init hello --pipeline report-to-file --pipeline http-post-report   # open with these starters
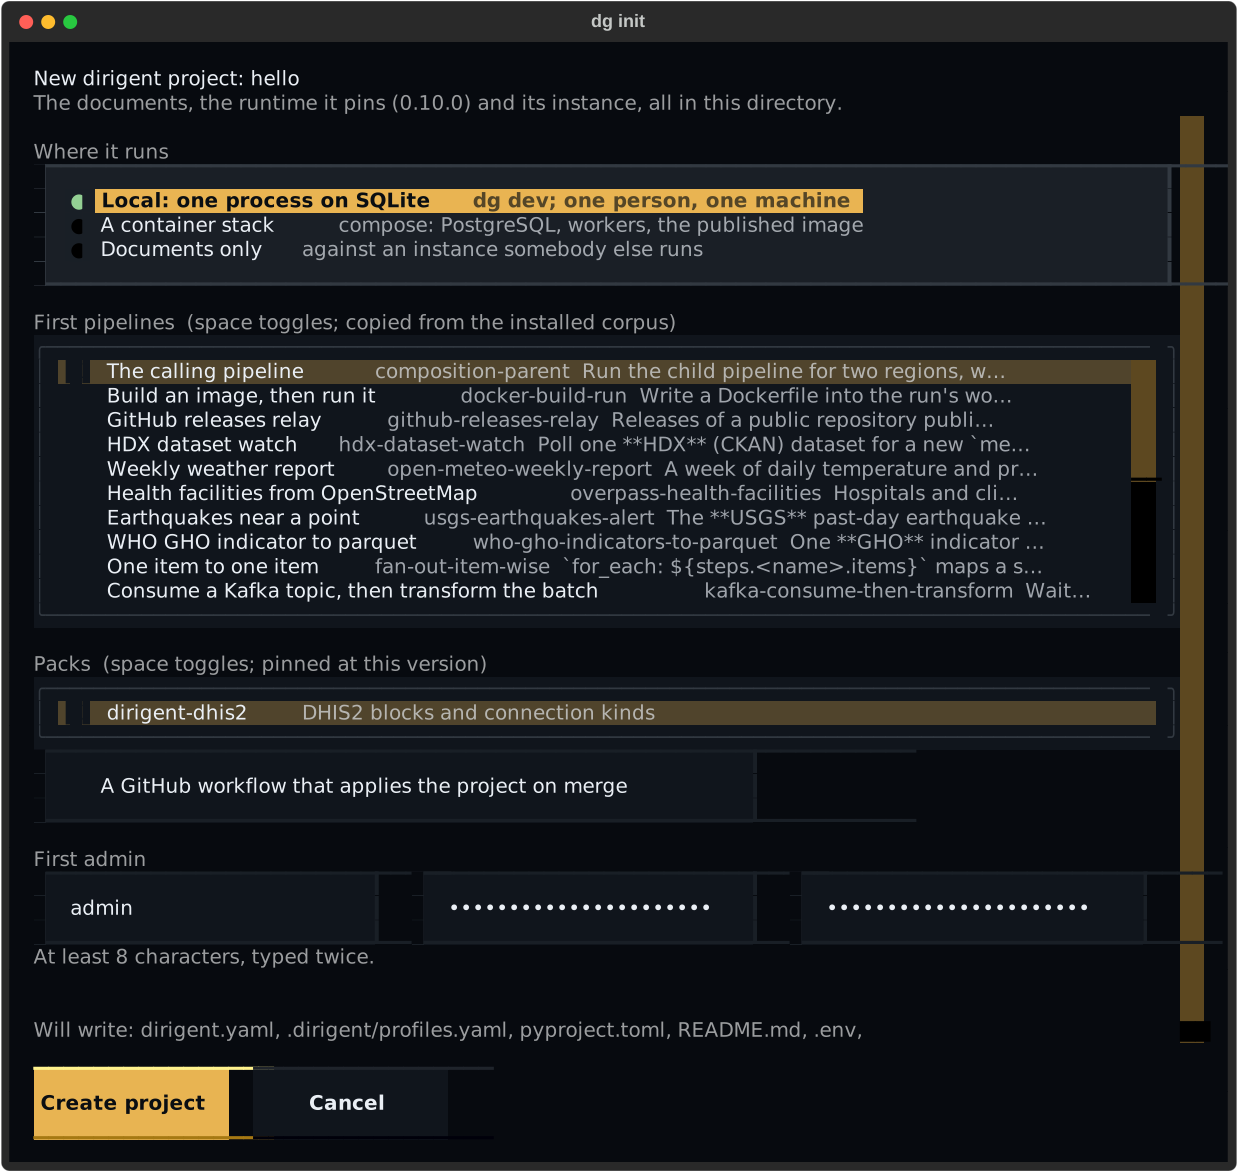
At a terminal, with no --template, dg init opens one form: where the project runs, which
services the stack carries, which packs come along, whether a GitHub workflow is written, and
the first admin's username and password, typed twice. Everything is visible at once and
nothing is written until Create; Escape leaves nothing behind.
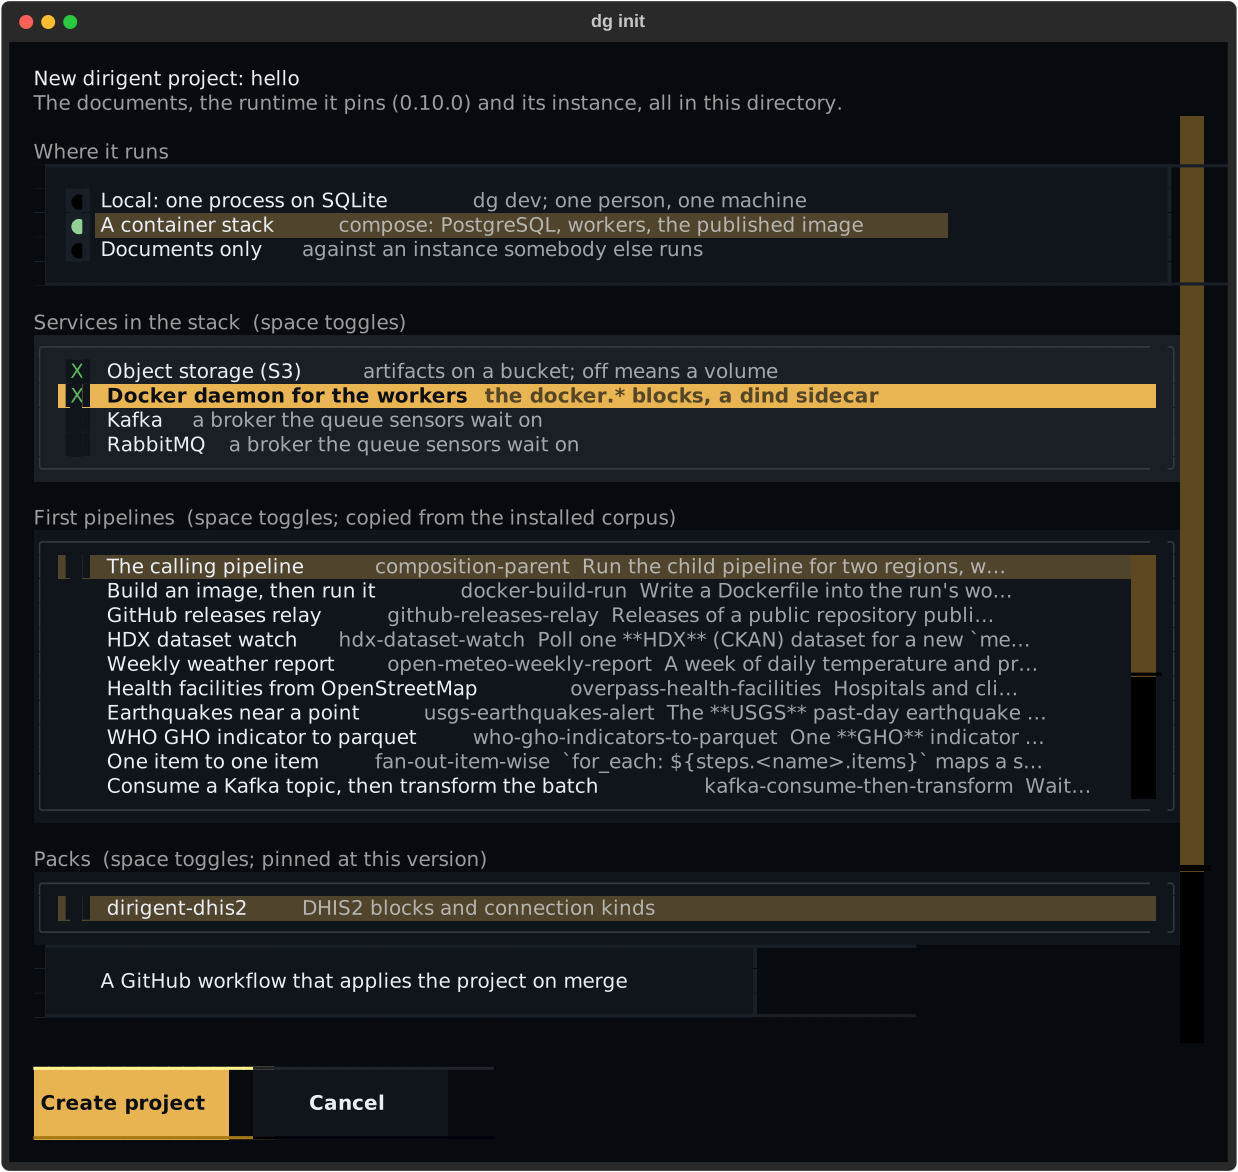
Choosing the stack shows its services, with object storage on and the workers' daemon toggled here, and the footer says what Create will write:
 The flags answer the same
questions for a script, and are what a pipe or CI uses: without a terminal there is no form,
and the defaults are
The flags answer the same
questions for a script, and are what a pipe or CI uses: without a terminal there is no form,
and the defaults are local with S3 on the stack.
--template local initialises an instance: it writes the documents, creates .dirigent/state/,
migrates the schema, creates the first admin and mints it one token. The token is shown once,
and written to the project's .env with owner-only permissions, where the local profile
reads it whenever the shell does not export DG_TOKEN. A generated DIRIGENT_SECRET_KEY goes
into that same file: a .env is a settings layer, so the instance seals connection secrets
under that key from its first command, with nothing to export. Give the password with
--password, or DIRIGENT_BOOTSTRAP_ADMIN_PASSWORD where there is nothing to prompt.
--service names what the stack carries beside PostgreSQL, the migration, the server and the
worker, and may repeat: s3 (object storage, on unless the flag says otherwise; off means
artifacts on a volume), docker (the workers' own daemon, so the docker.* blocks run),
kafka and rabbitmq (a broker, with its connection bootstrapped and a hello topic or queue
declared). --pipeline names a starter to copy into pipelines/, and may repeat; with none
named, pipelines/ is created empty and dg pipeline new is how a document arrives later.
--pack adds a published pack pinned at this version, dirigent-dhis2 today: a line in the
stack's Dockerfile, or a dependency in pyproject.toml for the other two templates.
--workflow writes .github/workflows/dirigent.yaml, which applies the project on merge.
What it writes is a uv project. pyproject.toml depends on dirigent-cli at the version of
the dg that scaffolded it, so uv sync builds the project's own environment and uv run dg
is that pinned runtime rather than whatever is on the path. A README.md carries the
template's commands, and a root .gitignore covers .venv/, __pycache__/ and .env. A directory
that already has a pyproject.toml or a README.md keeps its own -- the record lists those
under skipped, and adding dirigent-cli to that pyproject.toml is then yours to do; an
existing root .gitignore gains the missing lines instead.
It refuses to run over an instance that is already there: migrating and re-admining a live
database is not what running it twice means. --template documents scaffolds beside one
without touching it, which is what to use against a server somebody else runs.
Run the instance it made with uv run dg dev, in its own terminal in the project directory:
it keeps running, and serves the UI at http://127.0.0.1:3333. dg dev --wipe-state would
empty .dirigent/state/ first, taking the admin and the token dg init just created with it.
It never outlives the process that started it: a wrapper killed outright forwards no signal,
so dg dev watches its own parent and shuts down the way SIGTERM shuts it down once it is
reparented -- which also means backgrounding it past the shell that launched it ends it.
dg dev --seed DIR fills the instance the moment its API answers: every dirigent/v1
document under the directory, recursively and in path order, applied with its schedules
paused. The connections a connections.yaml declares go in first, and a document that
carries its own connections: or schemas: -- so that it also runs under dg run --local
-- has those created and is then applied without the section, which is the only form an
instance stores. A document this instance will not store is reported and passed over: a
corpus holds those on purpose. Name --seed more than once to seed one directory after
another, in the order given, which is how a directory holding a connection a later document
names goes in first. It seeds whatever instance is there, so without --wipe-state every
apply is an unchanged.
--seed-installed does the same for the corpus every installed plugin ships, so no checkout
and no path is needed: it walks the catalogue dg examples list reads and feeds each document
through the same apply. Both flags may be given, and the directories go in first.
dg dev --wipe-state --seed examples            # a fresh instance with the whole corpus in it
dg dev --seed examples --seed ../pack/examples # two corpora, in that order
dg dev --wipe-state --seed-installed           # every installed corpus, the packs' included
What it makes is one person's instance on one machine -- SQLite on this disk, with its key in
the project's .env, and no process to reach it from anywhere else. A real server is the
compose stack.
--template compose writes that stack instead: the same documents plus compose.yaml, a
Dockerfile, a .env holding a generated DIRIGENT_SECRET_KEY and the password it was
given, and a root .gitignore keeping that .env out of the repository. It initialises nothing
locally -- no state directory, no migration, no token -- because the instance is the
containers, and the first admin is admin with the password from the .env.
The stack runs the image that Dockerfile builds, and it builds on
ghcr.io/winterop-com/dirigent, pinned to the version of the dg that wrote the file.
Adding a pack later is a line in that Dockerfile and docker compose up --build.
--admin is refused with this template, and --service with the other two.
Like every command, dg init renders at a terminal and writes records into a pipe, and
--json asks for the records at a terminal: instance.initialised carries the token it minted, and
--template documents and --template compose write project.scaffolded instead, the latter
with the next commands that start the stack, beginning with uv sync. Both carry the
template, and the stack's services, any packs, and workflow when one was written.
Inside a project, dg apply with no argument applies every document, and dg apply
--dry-run is the whole-project diff. That plus a pipeline repository on GitHub is the entire
promotion story.
--prune reconciles the whole project: after applying every document, a pipeline an
earlier directory apply wrote and the project no longer holds is deactivated -- never
deleted. It marks this apply's documents with directory provenance, which is what a later
prune recognises as its own; a pipeline applied any other way is never touched. With
--dry-run it prints what a reconcile would deactivate without writing anything.
--paused creates the schedules an apply mints already paused, so a document whose clock is
due lands without firing. It governs what the apply brings into being and nothing else: a
schedule the instance already holds keeps the state an operator gave it, so re-applying
without the flag never re-pauses one somebody resumed, and re-applying with it never pauses
one already running. dg schedule resume PIPELINE CODE is how a paused clock starts.
Parameters
The CLI reads the pipeline's parameter schema before it sends anything, so a value is coerced to the type the schema declares and a typo is caught before a run is created rather than at 05:00. The entry paths all end in the same validated object:
# a scalar, coerced by the declared type
dg run daily-load -p day=2026-01-01 -p batch_size=1000 -p dry_run=true

# a dotted key addresses a nested leaf, at any depth
dg run daily-load -p server.tls.verify=false -p server.timeout=30

# an array or an object is given whole, in JSON or in YAML
dg run daily-load -p regions='[east, west]' -p filter='{"level": 3}'

# or element by element, with an index or with [] to append
dg run daily-load -p 'regions[0]=east' -p 'regions[1]=west' -p 'regions[]=north'

# or a whole payload from a file, with flags overriding it
dg run daily-load -P params.yaml -p dataset=incidence
batch_size is an integer because the schema says so, and a code parameter typed as a
string stays "3" rather than becoming 3. An enum value is checked against its members.
Precedence is schema defaults, then files in the order given, then -p flags in the order
given; objects deep-merge, arrays and scalars replace.
A path the schema does not declare is refused with the location named. That is stricter than
JSON Schema on purpose: a pipeline that lists its parameters has said what a run takes, so
-p dya=2026-01-01 is a typo rather than a new parameter, and JSON Schema would let it
through to be ignored at run time. A file is held to the same rule, and a name it supplies
that the schema does not declare is refused with the file named.
Brackets address an array element, and only brackets do: -p regions[0]=east,
-p limits.retries[2]=3, and -p targets[0].host=example.org all reach into an array the
schema declares, while -p regions.0=east is refused because a dotted path cannot tell the
index 0 from an object key named "0". An element is coerced by the items type the way a
scalar is coerced by its own. An index that already exists replaces that element, an index
exactly one past the end appends, and [] appends without counting; an index further out is
refused with the gap it would leave named, so -p regions[5]=east against an empty array is
refused rather than filling four elements with nothing. A negative index is refused, and so is
a path that reads a declared array as an object or a declared object as an array, in the
schema's own word. Flags compose with -P FILE as they always have: a file supplies the whole
array and a later -p regions[1]=west replaces that one element of it. Quote a bracketed key,
because a shell that globs reads the brackets first.
Running a document directly
dg run takes a pipeline code or a document, because they are one intent:
dg run daily-load -p day=2026-01-01 --watch     # a pipeline the instance already has
dg run ./daily-load.yaml -p day=2026-01-01      # apply it first, then run it
dg run https://example.org/daily-load.yaml      # a URL works too
dg run --local ./daily-load.yaml                # no server anywhere
--local needs the things a serverless run has nowhere to read from:
dg run --local ./document.yaml --connections connections.yaml
dg run --local ./document.yaml --schema ./shape.json
dg run --local ./document.yaml --enable-unsafe shell.run
dg run --local ./parent.yaml --also-apply ./child.yaml
A document that carries its own connections: block needs no --connections at all: a local
run seeds what the document brought. Where both carry the same connection code, the file wins,
so a published document can be pointed at your own instance without editing it. A server
refuses to apply a document that carries connections -- see
concepts.md.
A document may carry its schemas the same way, in a top-level schemas: section keyed by code,
and a local run seeds those too -- so a document that carries every shape its validate.schema
gates name runs with no --schema at all. A server refuses to apply a document that carries
schemas, exactly as it refuses carried connections.
--schema hands the run a JSON Schema to hold by code, so a document whose validate.schema
gate names one by schema -- and declares it in requires.schemas -- can run with no server.
The code comes from the schema's own $id, falling back to the filename stem, the same way
dg schema create reads it. Where a document carries a schema of the same code, the file wins.
Repeat the flag for each schema a document needs:
--enable-unsafe adds to the instance's allowlist for one command. It never turns the gate
off: shell.run and docker.run execute code on the worker, and "can edit pipelines" must
not silently mean "can run code on workers". It is repeatable and also takes a comma-separated
list, matching DIRIGENT_ENABLED_UNSAFE_BLOCKS:
dg run --local ./document.yaml --enable-unsafe shell.run --enable-unsafe docker.run
dg run --local ./document.yaml --enable-unsafe shell.run,docker.run
--root DIR holds the whole instance in DIR instead of a throwaway directory and leaves it
there, so a document whose second run reads what its first one wrote -- a marker file at
file://DIR/artifacts/<name> -- can be rehearsed a day at a time from the CLI:
dg run --local --root /tmp/rehearsal ./document.yaml --window 2026-09-05..2026-09-06
dg run --local --root /tmp/rehearsal ./document.yaml --window 2026-09-06..2026-09-07
--also-apply applies a document without running it, which is what a pipeline composed of
other pipelines needs: a throwaway instance starts empty, and pipeline.run can only start a
pipeline that is already there. Repeat it for each one. Against a real instance the child is
simply applied first, in the order requires.pipelines states.
A supporting document's own connections: and schemas: are seeded like the run's own, so a
child that carries the shapes its gates name runs as a child exactly as it runs on its own.
Where two documents carry the same code, the first to carry it keeps it, and a --connections
or --schema file still wins over both.
Watching a run
--watch and --local stream step transitions and block output, merged by timestamp so the
stream reads as cause then effect:
2026-01-01T18:22:23.019+01:00 [info    ] queued                         [step fetch] block=http.request attempt=1
2026-01-01T18:22:23.297+01:00 [info    ] http call                      [log fetch] method=GET status=200 duration_ms=278
2026-01-01T18:22:23.301+01:00 [info    ] succeeded                      [step fetch] block=http.request attempt=1 duration_ms=282
2026-01-01T18:22:23.462+01:00 [info    ] copied                         [log archive] bytes=48219
2026-01-01T18:22:23.470+01:00 [info    ] succeeded                      [step archive] block=storage.copy attempt=1 duration_ms=169
--watch reads that order off one stream, GET /runs/{id}/$events, which carries the
attempts as they move, the lines they wrote, and the run's own state every time it changes --
it starts and it settles on the same stream, not only the latter. --local has
the engine in the same process and merges the same two things there.
When a step fails, both print the diagnosis before exiting: the failing step, its block, the error class the block assigned, the message, and that attempt's log lines. For a local run that is not a nicety -- the database is deleted on the way out, so a failure that is not read out there is a failure nobody can investigate.
The exit code is the run's outcome: 0 for succeeded, non-zero for failed and cancelled, and
0 with a warning for completed_with_errors unless you pass --strict. --strict needs
--watch or --local, because those are the two shapes that wait for an outcome to judge.
Four exit codes, across every command:
| Code | Meaning |
|---|---|
| 0 | It worked |
| 1 | It ran and the answer was no: a failed run, a refusal from the server, an unhealthy connection |
| 2 | The command line is wrong: an unknown flag, a missing argument |
| 3 | It never got as far as running: the process refused the environment, a safety gate said no, or a local run could not be set up |
Code 3 is what separates "this pipeline is broken" from "this invocation is broken" in CI, which is the distinction a job needs to decide whether to page anyone.
The report a run wrote for itself
dg runs report RUN_ID summarises a run from live queries: what each step amounted to, and
how long the whole thing took. --markdown answers with something else -- the markdown
document the run itself rendered when it settled, stored with the run. It exists only when
the pipeline document declares a report: section, and the command says so when it does not.
The document is written as-is, so it pipes into a ticket, a pull request comment, or a file:
Under --json, or into a pipe, the same read is one run.report_document record carrying
the whole document. docs/reports.md says what a template may read.
When something is wrong
The default output is the run, not the CLI. Three levels above it, each adding something a person can name:
dg -v run --local ./document.yaml           # engine events, and the API calls the CLI makes
dg --debug run --local ./document.yaml      # engine internals; -d, or -vv, are the same flag
dg --debug-all run --local ./document.yaml  # everything, wire traces included
--debug is where dirigent's own decisions appear: which attempt was claimed and from what
state, which references a step resolved and what it read them from, how a failure was
classified and whether the retry budget covered it, when the next probe is due and why, and
which leases the worker still holds.
Verbosity raises dirigent's own loggers and nobody else's: at -v and at --debug, anything
outside the dirigent namespace -- alembic's migration history, SQLAlchemy's statements,
uvicorn's access lines, the HTTP stack's socket reads -- stays at WARNING. Asking for more
detail is asking for the engine's reasoning, and answering with a library's would bury it.
--debug-all lifts every cap and sets the level itself, so it is the one flag that needs
nothing beside it.
Precedence is the flag, then DIRIGENT_LOG_LEVEL, then quiet.
The stream is a protocol
Every line a run writes is one record. At a terminal the records are rendered; anywhere else, a pipe, a file, a container's log, an agent's shell, CI, they are written as NDJSON, one JSON object per line, without asking:
dg run --local ./document.yaml                 # rendered at a terminal; records into a pipe
dg run --local ./document.yaml --json          # records, even at a terminal
dg run --local ./document.yaml > run.ndjson    # kept, and read back with dg format -f
dg format -f run.ndjson                        # the same records, rendered
The records are the same whoever reads them, so a run watched live, the same run read back
off a file, and the same run parsed by jq are one thing rendered three ways. Verbosity
decides which records there are, and it decides that the same way under both outputs:
dg run -v at a terminal and dg run -v --json carry the same events.
-o / --output is a global option, valid on every command and in any position: -o json
(--json for short) forces records at a terminal, -o console forces the rendering into a
pipe. It beats the log_format setting, which is where a container, a project's .env or its
dirigent.yaml names the spelling once, under the same names and through the layers every
other setting is read from -- DIRIGENT_LOG_FORMAT is its environment variable. Precedence is
the flag, then the setting, then the terminal.
The console rendering
The rendering is lossy, and NDJSON is the parsing target
This section documents the grammar, which invites parsing it. Do not. The rendering shortens a URI against the run's scratch prefix, draws the closing record as a table, pads columns to a width it is free to change, and drops nothing only because no kind has yet needed it to. It is for a person to read.
Everything below is a rendering of the NDJSON above, and the records are the contract:
a field is stable, a column is not. dg run --json | jq is the supported way to read a
run by machine, and dg format is how the same records are made readable again.
| Part | What it holds |
|---|---|
AT |
The instant, ISO-8601 to the millisecond, in the reader's own offset |
[LEVEL] |
debug, info, warning or error, in brackets and coloured by severity |
MESSAGE |
What happened, in the words the event chose |
[KIND SOURCE] |
Which event this is -- run, step, log, output, process -- and the step beside it, push[east] for one element of a fan-out. A line about the run itself names only its kind |
| fields | Zero or more key=value. A value is bare when it is one token, a JSON string when it holds a space or a quote, and compact JSON when it is a structure |
Every part is always present, in that order, and the origin bracket is what a step is followed by down the page. The level and the message are padded so the brackets line up, and colour marks the level and the step; both are decoration, and the same line reads with or without them. A value wider than its column pushes the line out rather than being cut, and the terminal is free to wrap it.
2026-01-01T18:22:23.069+01:00 [info    ] succeeded                      [step fetch] block=http.request attempt=1 duration_ms=282
2026-01-01T18:22:23.297+01:00 [warning ] the region refused             [log push[east]] region=east status=503
2026-01-01T18:22:24.000+01:00 [info    ] ready                          [process] process=dev
compact is the same grammar with the padding spent on nothing:
2026-01-01T18:22:23.069+01:00 [info] succeeded [step fetch] block=http.request attempt=1 duration_ms=282
The machine encoding
NDJSON writes the same record as one JSON object per line, with structures left nested:
{"v":1,"at":"2026-01-01T17:22:23.069+00:00","level":"info","kind":"step","step":"fetch","item":null,"message":"succeeded","block":"http.request","attempt":1}
A listing writes NDJSON too: dg runs list is one record per run, dg pipeline list one
per pipeline, each naming its kind and carrying the row whole under fields. A command that
answers with a single thing -- dg runs show, dg system info, a minted token -- prints that
one response as one JSON object on one line, which is the server's own document rather than a
record.
dg dev, dg server, dg worker and dg scheduler follow the same rule: under compose,
systemd or docker logs there is no terminal, so they write NDJSON and nothing else, no
banner, no table, no colour; at a terminal they render the same lines. A process has one
stream: its logging joins the records on standard output rather than standard error, so one
pipe carries the whole story.
dg dev                             # rendered at a terminal
dg dev > dev.ndjson                # records, kept, and read back later with dg format -f
A command's diagnostics
A command is not a process: its story goes to standard output and its own logging to standard
error, so 2>/dev/null leaves a clean story and --json | jq cannot be polluted. Both read
in the same grammar -- a logging event says event and timestamp where a record says
message and at, and the logger names the source column when no step claims it:
2026-01-01T17:22:23.069+00:00 [info    ] pipeline applied     [log dirigent.pipelines] action=create
2026-01-01T17:22:23.253+00:00 [info    ] queued               [step greet] block=docker.run attempt=1
-v is what turns the diagnostics on. It means the same thing under both outputs: it decides
which records there are, never how they are spelled.
Selecting parts of the stream with jq
dg format renders every record. When you want particular ones instead, jq selects on
kind, which is the field the protocol reserves for exactly that:
# the token a dev instance mints, once, without reading the rest
dg dev | jq -r 'select(.kind == "process" and has("token")) | .token'

# only the run's log lines, without the engine's own events
dg dev | jq -r 'select(.kind == "log") | .message'

# every warning or worse, whatever emitted it
dg dev | jq -c 'select(.level == "warning" or .level == "error")'

# one step, followed down the page
dg run --local ./document.yaml --json | jq -c 'select(.step == "fetch")'

# and back to a rendered line once it is filtered
dg dev | jq -c 'select(.level != "debug")' | dg format
jq -c keeps one record per line, so the result is still NDJSON and dg format still reads
it. Use jq --unbuffered when following a live process, or the filter waits for the pipe to
fill before printing anything.
v is the protocol version. Within a version a field may be added, never removed and never
retyped, so a consumer that ignores unknown keys keeps working. Adding a kind is compatible;
removing or repurposing one is not. v, at, level, kind, step, item and message
are reserved: a block that binds a field with one of those names gets it as fields.<name>
rather than being able to change what a parser reads the record by.
The events
| Event | Written when | Fields |
|---|---|---|
run |
A run starts, and when it settles | pipeline, run_id, local, and priority where one was asked for. The closing one adds exit_code, error and the per-step steps and failures summaries in JSON; a watched run's also carries pipeline_version, triggered_by, duration_ms, items_total, items_failed and priority, and a kept --local run's its scratch and kept_at |
step |
An attempt changes state; the message is the new status | block, attempt, duration_ms once it has settled |
log |
A block writes a line | Whatever the block bound to it |
output |
A step settles, from -v up; the message is its status |
The output's own fields, or artifact and bytes when it went to storage |
process |
A long-running process starts, when it is ready, when dg dev --wipe-state clears its state, and when the process that started dg dev goes |
process, and for dg dev the api, docs, state, admin, token and migrated it would otherwise have printed; a state cleared carries the state it deleted and the hint that keeps it, and a parent gone the parent pid that went |
seed.connection |
dg dev --seed creates a connection a file or a document declares |
connection, connection_kind, action of created or updated, and the origin file it was read from |
seed.applied |
dg dev --seed stores one document |
document, pipeline, action, and the schedules_paused this apply brought into being |
seed.refused |
dg dev --seed meets something the instance will not take |
document and the reason it gave |
seed.done |
dg dev --seed finishes |
The directories it walked, and the pipelines, refused and connections it ended with |
Verbosity chooses events, never shapes. The default writes run, step and every log
line at info and above. -v adds the output event. -d adds the log lines a block
wrote at debug, and the engine's own reasoning. No flag changes what a line looks like or
how much of a value it carries.
Values are complete. The renderer never truncates a value, elides a middle, or drops a field: a value cut is a value nobody can parse or paste, and a field dropped is data lost without saying so. Where a value is genuinely too big to print, the block logs a summary field instead of the value -- an authoring decision, made once, visible in the block's code.
The one shorter form is a URI under the run's own scratch prefix, spelled relative to it in the console rendering. That is a spelling and not a shortening: the prefix is stated once, on the run's opening event, and the whole URI is recoverable from the pair. Two URIs that differ still read differently, and NDJSON carries every URI whole.
Reading a stored stream back
dg format takes NDJSON on standard input, or a file with -f, and renders it for reading.
It passes through anything that is not a record, so a mixed log still reads:
Which formatter renders the records is a positional rather than a flag, so a pipe reads
dg format compact rather than stuttering as dg format --format compact. A name that is
not a formatter is refused by name rather than guessed at.
| Formatter | Renders |
|---|---|
console |
Padded columns, then every field. What an omitted positional means. |
compact |
The same fields with no padding, and the time of day without the date. |
A formatter renders a whole record. It takes no template: docker and kubectl spell field
selection as --format '{{.Field}}', and here that is jq's job, over the same stream.
Selecting is jq and rendering is a formatter, which is why every record carries a kind:
one of them dispatches on it, the other selects by it.
Single-quote a jq filter. In bash a double-quoted "$x" inside one is replaced by the
shell before jq ever sees it, and braces around a comma are brace-expanded. Single quotes
pass a filter through whole.
A formatter is a name, a version and one method turning a record into a line. The registry
holds the built-ins and whatever a plugin in the dirigent.formatters entry point group
contributes, so a third party ships one without touching the CLI:
The plugin object behind that entry point answers a formatters() extension point with the
formatters it adds, and a name two packages both claim is refused rather than shadowed. The
plugins page shows one whole.
A formatter renders a record kind it has never heard of rather than failing, because a record from a newer dirigent, or from a plugin's own event, still has to read.
How much of a value the end-of-run table shows
The stream has already carried every value whole. The table printed when a run settles is a
summary of it, and that is where the three levels still choose a rendering: a container's
shape by default, its values at -v, the whole document at -d.
| Level | An output in the table |
|---|---|
| default | Shapes. status=200 headers={12 keys} body={3 keys} |
-v |
Values, each collection shown two levels deep and five elements wide, saying how many it left |
-d, -vv, --debug-all |
The whole value, pretty-printed as JSON |
"It produced a 12-key object" answers did it work; only the values answer why did it not. A step that logged warnings and still succeeded is flagged beside its name, where its outcome column keeps the terminal status it reached.
An output too large to inline was written to storage instead. The output event names the
artifact rather than showing a value you could not tell apart from an inlined one, and the
table does the same:
│ step   │ block        │ outcome   │ after │ duration │ output                    │
│ export │ storage.copy │ succeeded │ -     │ 1.2s     │ artifact a.json (48.2 kB) │
-d adds what was stored underneath that line, so the artifact is named at every level and
its value is there when it is asked for.
Records when nothing is watching
NDJSON is what every command writes when stdout is not a terminal, and what --json or
-o json asks for at one. It implies no colour, no spinner, no progress, and no prompts:
nothing reaches stdout that is not a JSON object, and a command that would have asked for a
value fails rather than blocking on a pipe. A script, an agent and CI never see anything else.
Two commands are the exception, and both answer with one plain line at a terminal and in a
pipe alike: dg --version and dg secret-key. The value is the entire output and there is
nothing to dispatch on, which is what makes DIRIGENT_SECRET_KEY=$(dg secret-key) work in a
shell and in a .env. Every other command follows the rule, dg init included.
A listing is a record stream like everything else: one line per row, each carrying its kind
and the row itself under fields. A row has fields of its own that a record also has -- a
schedule's kind is cron or interval -- so the row is kept whole under fields rather
than spread over the record's own keys:
dg runs list --status failed --json | jq -r '.fields.id'
dg blocks list --json | jq -r 'select(.kind == "block") | .fields.id'
A command that answers with a single thing -- dg runs show, dg runs report, dg system
info -- writes one record too, its kind the one its listing carries, with the thing whole
under fields:
For a command that streams -- dg run --watch, dg run --local, dg runs logs --follow -- it
is NDJSON: one JSON object per line, written and flushed as the thing happens. Every object
carries v, at, level, kind, step, item and message, and its kind says what it
adds to them:
kind |
What it is, and what it adds |
|---|---|
run |
The run itself, opening and closing. Opening: pipeline, run_id, local, scratch. Closing: exit_code, error, steps, failures, kept_at |
step |
One state an attempt passed through: block, attempt, and duration_ms on the one it settles in |
log |
A line a step wrote, with whatever it bound in fields |
output |
What a step produced, at -v and above; a block's own shape, so an HTTP call adds status, headers, body, body_bytes |
error |
A refusal, from the server or from the CLI |
A command that changes one thing writes one record naming the change, whose message is the
verb and whose fields are the identity of what changed:
kind |
Written by | What it carries |
|---|---|---|
config |
dg config show |
settings, secrets redacted |
db.revision |
dg db current |
revision, head, at_head |
db.history |
dg db history |
history, as alembic wrote it |
db.upgraded |
dg db upgrade |
database, target, and the revision it reached |
validation |
dg validate, dg pipeline validate |
code, document, problems[] of issues, and a valid pipeline's steps[] |
validation.shape |
dg validate --explain |
code, document, checked, the totals attempts_max, attempts_at_least and deadline_longest, one steps[] row per step of what it will cost, and warnings[] |
validated |
dg validate |
The closing count: documents, invalid |
apply |
dg apply |
One per document: under fields, the plan's action of create, update, unchanged or invalid, the code it applied under, and an invalid one's issues |
prune |
dg apply --prune |
The reconcile: under fields, the pipelines pruned, the trigger_documents_removed that went with them, and dry_run |
prune |
dg prune |
The retention sweep, in flat fields rather than under fields: total, dry_run, and a count per family; a sweep that ran adds the artifacts it deleted from storage |
backfill |
dg backfill |
pipeline, schedule, dry_run, windows_total, runs_created, and windows[] of window_start, window_end and the run_id each became |
pipeline.activated / .deactivated / .deleted |
dg pipeline … |
code |
pipeline.created |
dg pipeline new |
code, the starter it copied, the path it wrote, the copy's own requires, and the preflight list to work through |
schedule.created / .paused / .resumed / .deleted |
dg schedule … |
code, pipeline, and a live one's clock, timezone, next_fire_at |
webhook.created |
dg webhook create |
code, pipeline, the url to POST to, and the token itself, once |
webhook.token_rotated |
dg webhook rotate-token |
code, pipeline, url, and the new token, once |
webhook.deleted |
dg webhook delete |
code, pipeline |
alert_rule.created / .paused / .resumed / .deleted |
dg alerts rules … |
code, event, notifier, and a new one's scope, connection, throttle, and template and body as booleans saying whether the rule carries one |
notification.queued |
dg alerts test |
notification_id, notifier, connection, subject |
notification.retried |
dg alerts retry |
notification_id, notifier, subject, attempt, available_at |
connection.created / .updated |
dg connection create, dg connection ensure |
code, connection_kind, name, description, and the config with every secret field redacted |
connection.checked |
dg connection check |
code, healthy, detail, version |
connection.deleted |
dg connection delete |
code |
run.cancelled |
dg runs cancel |
run_id, status |
run.retried |
dg runs retry |
run_id, step, item, and the attempt it minted |
schema.created |
dg schema create |
code, name |
schema.deleted |
dg schema delete |
code |
trigger_document.deleted |
dg trigger-document delete |
code, and that its schedules and webhooks went with it |
token.revoked |
dg admin token revoke |
code, and username when --user named one |
token.issued |
dg auth login, dg admin token create |
username, the token's name, and the token itself, once; a login adds the url, a mint the prefix |
pipeline.exported |
dg export |
code, the version asked for, the document it exported, and the path when -f wrote it |
example.written |
dg examples show -f |
code, and the path the document was written to |
example.source |
dg examples show |
The example itself: code, name, description, tags, shelf, plugin, starter, requires, and the source verbatim |
run.detail |
dg runs show |
The run, its dag, its items and its attempts, under fields |
run.report |
dg runs report |
What each step amounted to and how long it took, under fields |
run.report_document |
dg runs report --markdown |
run_id, and the markdown document the run rendered when it settled |
run.profile |
dg runs profile |
The chain that decided the run: run_id, pipeline, status, duration_ms, critical_path, and the queued_ms, running_ms and waiting_ms along it |
run.profile.step |
dg runs profile |
One step on that chain: step, block, attempts, queued_ms, running_ms, waiting_ms |
run.profile.warning |
dg runs profile |
One cause the timestamps prove: the step it is about and the cause |
docker_reaped |
dg docker reap |
One compose project: project, run_id, run_status, whether it was torn_down, and the detail when it was not |
system.info |
dg system info |
The instance the CLI is talking to, under fields |
check |
dg system health … |
One check: check, status, probe, the code of the message it found and its params, and what it found as the message |
health |
dg system health |
The closing verdict: checked, healthy, absent, unhealthy |
auth |
dg auth status |
url, source, username, role, via |
user.created |
dg admin user create |
username, role, database |
password.changed |
dg auth password |
other_sessions |
password.reset |
dg admin user password |
username, sessions |
project.scaffolded |
dg init --template documents, dg init --template compose |
template, directory, version, files[] including the pyproject.toml that pins the runtime, skipped[] for files already there, and next[], the uv run dg commands that start a scaffolded stack |
instance.initialised |
dg init |
template, directory, state, schema, admin, version, files[] including the pyproject.toml that pins the runtime, skipped[] for files already there, and the token it minted |
The message is the status a run or a step reached -- started, queued, succeeded --
so a state is read off the line rather than out of a separate field. item is the fan-out
element, or null for a step that does not fan out. The closing run record is always the
last line: it carries the run's terminal status as its message, the process exit code, and the
per-step summary the end-of-run table would have shown -- steps[] of step, item, block,
status, depends_on, warnings, attempts, duration_ms, output, error,
artifact_uri, artifact_bytes, and failures[] for the ones that failed.
An error object is the API's own problem shape -- status, title, code, params,
problems, instance, with the detail as its message -- and a kind added, so one reader
handles a refusal from the server and a refusal from the CLI the same way. code is the
dotted code of the catalogued message the sentence was rendered from, stable across
rewordings, and params carries what it interpolated; problems is a list of issues, each
one code, message, params and a location where it is addressed at a place, so a
reader picks refusals out by code rather than by matching their English. Every guard the CLI itself decides on is
one of these -- dg worker or dg scheduler on SQLite, dg dev on PostgreSQL, an -o or a
dg format argument that names nothing -- and the two that name a missing output or a missing
formatter are written in the default one, since what was asked for is exactly what is missing.
It goes to stdout like every
other object, and the exit code is unchanged: 1 for a failed run or a refusal, 3 for an
invocation that never got as far as running.
# what each dataset actually came back with, in the order the items settled
# an output record exists from -v up
dg run --local examples/graph/fan-in.yaml -v --json \
  | jq -r 'select(.kind == "output") | "\(.step)[\(.item)] \(.status)"'

# fetch[humidity] 200
# fetch[wind] 200
# fetch[pressure] 200
# fetch[temperature] 200
# report[null] 200

# and the verdict, once: the run record that carries an exit code is the closing one
dg run --local examples/graph/fan-in.yaml --json \
  | jq -r 'select(.kind == "run" and has("exit_code")) | .message'
Because the stream is written as it happens rather than at the end, jq --unbuffered follows a
long run live, and a closing run line that never arrives means the run never settled.
Reading a run's stream
--watch and --local print one line per step transition and one per log entry a block
wrote, merged by timestamp so the stream reads as cause then effect:
2026-01-01T18:22:23.019+01:00 [info    ] running                        [step fetch[temperature]] block=http.request attempt=1
2026-01-01T18:22:23.297+01:00 [info    ] http call                      [log fetch[temperature]] method=GET url=https://postman-echo.com/get status=200 bytes=227 duration_ms=278
2026-01-01T18:22:23.301+01:00 [info    ] succeeded                      [step fetch[temperature]] block=http.request attempt=1 duration_ms=282
A step that fans out is labelled with the element it is working on, because four attempts of
one step are four different things. A log line carries the fields the block bound to it, which
is the half that says what happened rather than that something did. A step that logged nothing
of its own -- a transform, a conversion, anything the engine does without a subprocess -- still
leaves one line, finished with duration_ms and output_bytes, or failed with the error
class, so no run is a silent movie.
When the run settles, both print a table of what each step produced, in the order the steps
ran rather than by name, so it agrees with the stream printed above it. An after column
names what each step waited for, so the table says both when a step ran and why it ran then. A step sorts on when
it started, which puts it after everything it waited for; the items of a fan-out step stay in
item order, since that is the sequence that means something there. That table is a convenience
against a server and the only chance against --local, whose database is deleted on the way
out -- unless --keep says otherwise:
--keep leaves the throwaway SQLite file and artifact directory in place and prints both the
directory and the prefix the run wrote under, so DIRIGENT_DATABASE_URL can be pointed at it
and the run read back with dg runs show.
--root DIR holds the instance in a directory of your own and never deletes it, so a second
run with the same root finds the first run's history and the files it wrote under
file://DIR/artifacts:
${run.scratch} stays per run, under runs/<id>, so a document that wants a path two runs
share -- yesterday's list a sensor waits for, say -- writes it at ${artifacts}/<name>
instead, which is the root itself and therefore file://DIR/artifacts/<name> here.
dg runs show --json writes one run.detail record whose fields carry the run, its DAG,
its items and its attempts, which the CLI composes: the server answers the run and its counts,
and the items and attempts are walked off their own paged sub-resources.
Why a run took as long as it did
Every step and every attempt says where its time went, split three ways. Queued is from the moment an attempt became claimable -- its upstream done, or a retry's backoff expired -- until a worker took it up, so queued time is workers being busy and nothing else. Waiting is the engine parking the attempt on purpose: a retry's backoff, and the intervals between a sensor's probes. Running is a call in flight. A step that never started puts nothing on the clock: what it sat through belongs to the steps above it.
dg runs show carries the three on each step and each attempt. dg runs profile RUN answers
the question they are for:
dg runs profile RUN_ID
dg runs profile RUN_ID | jq -r 'select(.kind == "run.profile.warning") | .message'
It walks back from the step that finished last through whichever upstream held it up, which is
the chain that decided the run's wall clock; everything off that chain ran beside it and cost
the run nothing. One run.profile record carries the run, the chain and the three totals along
it, one run.profile.step record follows per step on the chain, and a run.profile.warning
record is written for each cause the timestamps prove: a probe cadence far longer than the work
it waited on, a deadline many times the wait a sensor needed, and a fan-out whose elements never
overlapped. A run with none of those is told nothing rather than guessed at.
The command tree
dg --help groups the tree into six panels, in the order of a working day: Run,
Define, Connect, Triggers, Processes, Administration. Everything below is
filed under exactly one of them.
These options are declared on dg itself rather than on a command, and work in any
position: --url, --token, --profile, -o/--output, --json, and
-v/-d/--debug-all. One that takes a value carries it along, so dg run --local
doc.yaml -o json and dg run -o json --local doc.yaml are the same invocation.
# Run
dg run CODE|file|url [-p key=value] [-P FILE] [--watch] [--strict] [--as CODE] [--window A..B]
dg run ... [--log-level debug] [--log-level acme.*=debug]   # what the run's log keeps; info and up when omitted
dg run ... [--priority low|normal|high]                      # how far ahead of other runs it is claimed
dg run --local file|url [--connections FILE] [--schema FILE] [--enable-unsafe BLOCK,...] [--also-apply FILE] [--keep]
dg run --local ... [--root DIR]                              # hold the instance in DIR and keep it, so a later run reads it
dg backfill PIPELINE --schedule CODE --from A --to B [--dry-run]
dg runs list [--pipeline CODE] [--status failed] [--since 24h] [--tag nightly] [--limit 50]
dg runs show | cancel | report | profile RUN_ID
dg runs report RUN_ID [--markdown]      # the document the run rendered, when it declares `report:`
dg runs logs RUN_ID [--follow] [--step NAME]
dg runs retry RUN_ID --step NAME [--failed-items]
dg format [console|compact] [-f FILE]   # render an NDJSON stream; reads stdin by default

# Define
dg init [DIR] [--template local|compose|documents] [--service S]... [--pack P]... [--pipeline STARTER]...
dg init ... [--workflow] [--admin NAME] [--password ...]
dg apply [file|url|-] [--dry-run] [--as CODE] [--paused] [--prune]
dg validate [file|url] [--server] [--explain]
dg export CODE [-f FILE] [--version N]
dg pipeline list [--tag climate] [--tag http]   # repeat --tag to narrow: every tag named must be worn
dg pipeline show CODE | versions CODE
dg pipeline activate | deactivate | delete CODE
dg pipeline validate CODE [--version N] | --all   # re-check what is stored against this instance
dg blocks list [--kind operator|sensor] | show BLOCK_ID
dg blocks new NAME [--directory DIR]      # scaffold a new block pack
dg examples list [--tag T]... [--shelf S] [--plugin P] [--starter] [--local]
dg examples show CODE [-f FILE] [--local] # the document, verbatim, as the shelf holds it
dg pipeline new STARTER [--code X] [--dir DIR] [--local]   # copy a starter into this project
dg schema list | show CODE | delete CODE
dg schema create FILE|- [--code CODE] [--name TEXT] [--description TEXT]

# Connect
dg connection list | show CODE | check CODE | delete CODE
dg connection create KIND CODE [--name TEXT] [--set field=value] [--description TEXT]
dg connection ensure KIND CODE [--name TEXT] [--set field=value] [--description TEXT]

# Triggers
dg schedule create PIPELINE CODE --cron "0 5 * * *" [--tz UTC] [-p k=v] [-P FILE] [--log-level ...]
                                [--name TEXT] [--description TEXT] [--priority low|normal|high]
dg schedule create PIPELINE CODE --interval 1h | --at 2026-01-01T05:00:00Z
dg schedule list | pause | resume | firings | delete PIPELINE CODE
dg webhook create PIPELINE CODE [--map param='$.path'] [--hmac-secret S] [--rate-limit 60]
                                [--name TEXT] [--description TEXT] [--priority low|normal|high]
dg webhook list | rotate-token | deliveries | delete PIPELINE CODE
dg trigger-document list | show CODE | delete CODE
dg alerts rules list | pause | resume | delete CODE
dg alerts rules create CODE --event run_failed --notifier log
                            [--name TEXT] [--description TEXT]
                            [--pipeline P] [--importance routine|normal|critical]
                            [--connection C] [--throttle 0s]
                            [--template T] [--body T | --body-file F]
dg alerts test NOTIFIER [--connection CODE] [--subject TEXT]
dg alerts queue
dg alerts retry NOTIFICATION

# Processes (container entry points)
dg dev [--host H] [--port 3333] [--ui/--no-ui] [--wipe-state] [--seed DIR]... [--seed-installed]
dg server [--host H] [--port 3333] [--reload] [--no-scheduler] [--ui/--no-ui]  # dg serve works too
dg worker [--concurrency N] [--tag T] [--name NAME]   # --tag is what this worker advertises
dg scheduler                            # the clock on its own; PostgreSQL only
dg docker reap [--dry-run]              # compose stacks left up by runs that have ended

# Administration
dg --version | dg config show
dg secret-key                           # a DIRIGENT_SECRET_KEY, on one plain line
dg prune [--runs 30d] [--logs 7d] [--deliveries 30d] [--firings 30d] [--notifications 30d]
         [--no-scratch] [--dry-run]     # an age given here beats the configured one
dg db upgrade [REVISION] | current | history
dg auth login [--username U] [--password P] | dg auth status   # login emits the token it minted
dg auth password [--current P] [--new P]
dg system info | dg system workers
dg system health                        # everything this host runs
dg system health database | worker | scheduler | server [--liveness]
dg admin user create NAME --role admin|operator|viewer [--password P] [--email E]
dg admin user list | activate NAME | deactivate NAME
dg admin user password NAME [--password P]
dg admin token create NAME [--user U] | list | revoke NAME [--user U]
dg auth login mints an API token and is the one place it is readable, so it writes a
token.issued record carrying the token itself -- a scripted login reads it off the stream,
and at a terminal it is spelled as the export DG_TOKEN= line to paste. dg auth status answers
with an auth record naming the server, where that URL came from, and who the CLI is; with
no token at all it refuses rather than saying nothing.
--tag is the server's own filter on both listings that take it, so a row it leaves out is one
the CLI never read. It repeats, and repeating it narrows: dg pipeline list --tag acme --tag
nightly lists the pipelines wearing both, and dg runs list --tag nightly --status failed is
every failed run of a pipeline tagged nightly -- the tags are the pipeline's, asked as it is
tagged now, because a run pins its version and never its pipeline's vocabulary. A tag is
lowercased when the document is applied, so --tag Acme matches nothing and --tag acme
matches what tags: [Acme] stored.
dg worker --tag is the other --tag and a different thing entirely: it is what one worker
advertises it carries, which the claim routes on rather than filters by. See
routing by tags.
Every listing above walks the server's cursor for you: dg asks for a page, follows next
until there is nothing left, and writes one record per row, so nothing downstream of a pipe
ever sees a page boundary. dg runs list --limit bounds the total rather than one page.
Defaults worth knowing: dg runs list --limit is 50, which is the server's own default for
that endpoint rather than a second number the CLI invented; --tz is UTC; a webhook's
--rate-limit is 60 deliveries a minute; an alert rule's --throttle is 0s, meaning no
throttling. --host and --port default to whatever the instance's
settings say, which is 127.0.0.1:3333 out of the box.
Every list above also answers to ls -- dg runs ls, dg pipeline ls, dg alerts rules
ls. The alias is hidden from --help, which teaches one name; it exists because fingers
type the other one.
Accounts and tokens live under dg admin and the worker registry under dg system, because
the help screen should show the same boundaries the API enforces: dg admin is the part only
an admin may use, and dg system is what this instance is and whether it is well.
dg system holds both views of the instance. dg system info and dg system workers are the
API view: a server answers them, and they carry a token. dg system health is the process-side
one, like dg db: no token, the configured database read directly, a server asked only over
plain HTTP. Bare, it answers "is my instance OK?" for the instance this shell resolves -- the
database and its schema, every worker the instance has, whether schedules are firing on time,
and the server DG_URL or the profile names (this host's own loopback when nothing is named).
A machine with no instance says so in one line. Naming a component is the assertion that it
should be here, so a worker that is simply not there fails dg system health worker and does
not fail dg system health; containers' HEALTHCHECKs use the named forms. Every form writes
one check record per check and exits 0 or 1; the bare form adds a closing health verdict,
because it is the one that checked more than one thing.
dg connection create
A connection's secret fields are never echoed: at a terminal they are asked for, and the answer
is hidden as it is typed. Which of them are asked for depends on how the command was spelled.
An invocation carrying --set has said what it wants, so it is asked only for a field the kind
cannot do without -- a one-liner runs to completion instead of stopping on an optional field it
deliberately left out:
dg connection create http ops-api --set base_url=https://ops.example.org \
  --set basic_username=ops --set basic_password=district
A bare dg connection create KIND CODE is the interactive form, and there every secret the kind
declares is offered in turn: Enter leaves one unset. In a script -- a pipe, a container, CI --
nothing is asked at all, and a required field that arrived through no --set is a refusal
naming the flag to pass.
An empty value is not a credential: --set bearer_token= leaves the field unset rather than
sealing an empty string, so every read afterwards says null rather than ***. A required
secret given empty is refused exactly as one left out is.
dg connection ensure
dg connection create talks to the server and needs a token. dg connection ensure is the
process-side twin, like dg db upgrade: it reads the database URL and DIRIGENT_SECRET_KEY
from the configuration and writes the row itself. It exists because a bootstrap container has
no token to authenticate with -- it is how infra/compose.yaml puts the storage connection in
place before the server and worker start.
dg connection ensure s3 artifacts \
  --set endpoint_url=http://s3:9000 --set bucket=dirigent \
  --set access_key_id="$S3_ACCESS_KEY" --set secret_access_key="$S3_SECRET_KEY" \
  --set path_style=true
It is idempotent, and declarative rather than incremental: it creates the connection or brings
the one it finds to exactly what the arguments say, so a field left out is cleared rather than
kept. The config is validated against its kind and its secret half sealed with the instance
key by the same code the API path uses, so the row is indistinguishable from one
dg connection create made. It states which of the two it did as its record kind --
connection.created or connection.updated -- carrying the row it wrote with the secret
fields redacted the way every read redacts them.
Unlike create it never prompts: every value arrives through --set, which is what makes it
usable from a container. Give the secrets to it as environment variables, so they are never
written to a file or an image layer.
Triggers, from the command line
A schedule takes exactly one clock, in its own timezone, and its parameter overrides are built
against the pipeline's own schema by the same builder dg run uses -- so a typo is refused
when the schedule is created rather than discovered at five in the morning when it fires.
dg schedule create daily-load nightly --cron "0 5 * * *" --tz Europe/Oslo -p environment=production
dg schedule list daily-load
dg schedule firings daily-load nightly      # what it actually did, skipped firings included
dg schedule pause daily-load nightly
Resuming recomputes the next firing from now rather than replaying every slot that went by while it was paused -- which is the same reason the misfire policy exists.
Clocks for a pipeline defined in another file are a document of their own, and dg apply
takes it exactly as it takes a pipeline document: kind: triggers, one pipeline:, and a
triggers: section. Applying one is refused while the pipeline it names is absent or
inactive, so apply the pipeline first -- a whole-project dg apply does that for you.
dg apply clocks.yaml                        # says which pipeline it schedules
dg trigger-document list                    # every clock file, and what each one fires
dg trigger-document show fleet-clocks       # the schedules and webhooks it owns
dg trigger-document delete fleet-clocks     # the document and its rows; the pipeline stays
dg schedule list says which document declares each row, so a clock a document owns is never
mistaken for one somebody added by hand. dg run --local refuses a triggers document: it
declares clocks for a pipeline and has nothing to run itself.
Priority, when one run cannot wait
Every run carries a priority -- low, normal or high -- and the claim takes a higher one
first. A document declares its own, a schedule or a webhook may override it for what it
triggers, and --priority overrides it once more for one ad hoc run:
--priority is a flag on dg run, dg schedule create and dg webhook create. A schedule's
and a webhook's own priority is also a priority: in the document that declares it, or the
priority field of the API's create body; one created without any of them fires at the
pipeline's own.
The word is resolved and pinned when the run is created, so editing the document afterwards
never reorders a run already in flight. Nothing is preempted: a high run's attempts are
claimed before every other run's the moment a worker slot frees, but an attempt already
running is never cancelled to make room for it. --priority orders a run against the others
queued, so it is refused with --local, where there are none.
Almost every run is normal, so a column of the word would say nothing and none is drawn.
dg runs list marks the exceptions beside the run id instead: a red ! for high, a muted
low for low, nothing at all for normal. A watched run's closing record carries
priority, and its header is marked the same way.
Windows, and filling the ones that went past
A schedule-fired run carries the interval it covers, derived from the cadence: the window
ends at the firing's own due time and starts at the occurrence before it. A document reads
the pair as ${run.window.start} and ${run.window.end}, so a step asks the upstream system
for the day that just closed rather than for whatever "yesterday" means at the moment the
worker got round to it.
Nothing in a document declares a window, so an ad hoc run has to be given one. It is one flag and two ISO 8601 instants:
dg run daily-load --window 2026-06-01..2026-06-02
dg run daily-load --window 2026-06-01T05:00:00+02:00..2026-06-02T05:00:00+02:00
An instant written without an offset is read as UTC -- a flag names no zone, and a window
whose meaning came from the shell's own would put the same command on two different days on
two machines. Both ends are given or neither is, and a window that runs backwards or covers
nothing is refused before the server is called at all. A run that carries no window refuses
${run.window.start} rather than resolving it to an empty string, because an empty string
there asks the upstream system for everything it has.
dg backfill creates the runs a cadence has already gone past. It takes the schedule whose
cadence defines the windows and the interval to enumerate, and creates one run per window,
oldest first:
dg backfill daily-load --schedule nightly --from 2026-06-01T05:00:00Z --to 2026-07-01T05:00:00Z --dry-run
dg backfill daily-load --schedule nightly --from 2026-06-01T05:00:00Z --to 2026-07-01T05:00:00Z
--dry-run asks the server for the same plan and creates nothing, which is the form to run
first: the windows come back exactly as they would be filled, with no run ids on them.
The interval is half-open, [from, to), so two adjacent backfills tile without overlapping.
Each run is given the schedule's own pinned parameters and is attributed to the backfill
rather than to a firing -- the schedule's clock and its firing history are untouched, because
these firings never happened. One request will not create more than 200 runs; past that it
refuses and names the count it computed, which is what catches a mistyped year before it
becomes a thousand runs.
A webhook's token is minted by the instance and printed once, with the URL already assembled, because only its hash is kept:
dg webhook create daily-load from-upstream --map day='$.published.date'
#   POST  http://localhost:3333/hooks/pl-ptb4fADzSVliZ_gm4k7z2oSnRR9qu-Rc8-XKZrNw
#   Token pl-ptb4fADzSVliZ_gm4k7z2oSnRR9qu-Rc8-XKZrNw

curl -X POST "$DG_URL/hooks/$TOKEN" -d '{"published": {"date": "2026-01-01"}}'
dg webhook deliveries daily-load from-upstream
dg webhook rotate-token replaces a token nobody wrote down, and invalidates the old one
immediately. dg webhook deliveries shows refusals as well as acceptances, which is the half
that answers "the upstream system says it has been calling us all night".
Alerting, from the command line
dg alerts rules create page-ops --event run_failed --notifier log --throttle 15m
dg alerts rules create loud --event run_failed --notifier log \
  --template '{{ pipeline.code }} failed after {{ run.duration_ms | duration }}' \
  --body-file alert-body.md.j2
dg alerts rules create wake-me --event run_failed --notifier log --importance critical
dg alerts test log                          # one message, through the real queue
dg alerts queue                             # what is queued, sent, or stuck
--template is the subject and --body is the body, both Jinja templates over the run's
facts; --body-file reads the body from a file instead, and naming both is refused. A rule
with neither says {{ run.pipeline }} run {{ run.status }} over the run's facts one per line.
Both are compiled when the rule is created, so a template that does not compile is refused
here with the line it broke on. Report documents is the context reference.
--importance is the least a pipeline's document must declare before the rule fires:
routine, normal or critical. A rule without it fires whatever the pipeline is worth, so
one rule pages for the critical failures and another logs every failure there is. The listing
says the floor inside the scope cell -- "global, critical and above" -- rather than in a column
that would be empty on almost every row, and the alert_rule records carry importance as its
own field either way.
The channels a rule may name, and the connection each one delivers through, are in notifier channels.
dg alerts test names the notifier rather than the connection, with --connection as an
option: a credential record does not determine which channel delivers through it, and the
channel is what is being tested. The message goes through the same queue and the same notifier
call a real alert does, because a test that took a shortcut would prove only that the shortcut
works -- so it appears in dg alerts queue and is delivered by a worker, not by the API.
dg alerts rules pause holds a rule's deliveries and resume lets them go again. Pausing is
instance state on the row rather than something the rule declares, so a rule held here keeps
holding when the document that declared it is applied again, and the engine skips it when it
decides what a settled run owes.
dg alerts retry takes a notification's id and makes that row due now: the backoff goes, the
attempt counter starts over, and a worker claims it on its next pass. A row a worker is
holding is refused rather than handed to a second one.
dg admin user create is a process-side command like dg db upgrade: it runs against the
configured database rather than the API, because the first account on a fresh instance has to
exist before anything can authenticate to create it. In a container,
DIRIGENT_BOOTSTRAP_ADMIN_PASSWORD does the same thing unattended, and does nothing once an
account exists.